However, there are two reasons why we think it makes sense to spend time in warehouses:
- Firstly, there are supply chain designs, where warehouses are without a practical alternative, until manufacturing makes another big step forward
- Secondly, there will always will be products which require storage, for instance as part of a maturing process.
For example, if Bosch promises one of its customers in Indonesia a 24 hour replenishment time for power tools, power tools that are produced all over the world, and in this instance in Hungary, in order to meet customer expectations we need regional warehouses within 24 hours driving distance.
As long as there is a need for warehouses we should capacitate them to meet delivery, quality and cost performance targets.
The Bosch Group has more than 800 warehouses in over 60 countries. Nearly half of the Bosch warehouses are operated by Bosch and the other half are run by logistics service providers. High delivery performance targets and quality requirements have to be fulfilled within the warehouses and this factor is crucial to the success of the company. However, despite their fundamental necessity, warehouses cause significant cost. A Bosch internal study showed a serious gap between the lean maturity level achieved in production and the level achieved in the warehouses.
In order to close this gap, the Bosch Group, with the guidance and support of the Karlsruhe Institute of Technology‘s (KIT) Institute of Material Handling and Logistics (IFL), established a pilot project called the Warehouse Excellence (WE) project to test and evaluate the adaptation of the Bosch Production System in warehouses. The Bosch Group also decided that an additional goal of the project was to measure the impact of the Bosch Production System (BPS) on performance indicators. This impact measurement would form the basis for the decision for a worldwide roll out that would affect all 800 warehouses.
The WE group was chosen randomly and consisted of 16 warehouses located in seven countries. The group contained six distribution warehouses, seven plant warehouses, and three raw material warehouses. The 16 warehouses handled three different types of business, those being: automotive technology goods; industrial technology; as well as, consumer goods and building technology. Out of 16 warehouses 14 were single user warehouses handling one business. Two of the 16 warehouses were multi-user warehouses and each handling two different businesses. In total, two were involved in industrial technology, 10 warehouses handled automotive technology, and six dealt with consumer goods and building technology. Eight of the warehouses were operated by Bosch and another eight by logistics service providers. These included three of the five biggest logistics service providers worldwide as measured by the turnover.
The WE group was compared to a control group of another 56 warehouses, where no extraordinary lean empowerment program was executed. The control group was already monitored and measured and throughout the study we did rely on the existing data because introducing transparency measurements could be considered an execution of influence which did not fit a particular control group.
The project ran from November 2010 to March 2012. Key performance indicators are available from January 2010 to December 2011. It is safe to assume that there was less focus on lean in the year 2010 than in the year 2011. So, ideally, these two years can be compared with each other. The following section describes the empowerment program, milestones, and the available data that was gathered during this period.
Empowerment
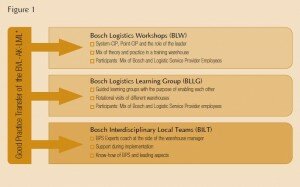
The actions undertaken within the warehouses were based on an empowerment program. Figure 1 shows the four elements contained within the empowerment program. The empowerment program was based on the available knowledge of lean management in general and the experience of basis point (BPS) experts. The aim is to enable the warehouse managers to drive the continuous improvement process. The systematic and
analytic approaches of system-CIP (clean in place) and point-CIP play a significant role in the achievement of that goal. The system-CIP approach develops improvement measures from the business requirements, the company’s “true north”, as well as, the current situation and the future states. Point-CIP provides support to stabilize these previously implemented future states.

Figure 1
The empowerment program consists of four elements that are described below. Each of the three Bosch Logistics Workshops (BLW) were held over two days. Each workshop sought to introduce knowledge about the system-CIP (BLW I), the point-CIP (BLW II), and especially problem solving (BLWIII) in a practical way. For example, the theory behind value stream mapping was taught in an hour-long classroom lecture. The participants then tried value stream mapping within instructor led groups in the warehouse. A separate session was necessary for problem solving because it required special attention. The first workshop took place in December 2010, the second in March 2011, and the last in June 2011. The Bosch LogisticsLearning Groups (BLLG) helped warehouse managers to solve upcoming problems together as a team. Regular one-and-a-half-day-long joint reviews of different warehouses also supported knowledge
transfer between warehouses. The participants met six to seven times during the project period. The Bosch Interdisciplinary Local Teams (BILT) supported knowledge transfer from the workshops to the warehouse operations of the participants. Lean experts coached warehouse managers to adjust and implement the previously acquired methodologies. The coaches also provided detailed feedback to those in leadership roles. The final component was the exchange of good practices with the lean management working group in the warehouses of the German Logistics Association (BVL). In this working group, several companies identified the lean success factors and tested these in pilot warehouses of their own. Furmans and Wlcek (2012) summarized and published the results.
Milestones
Milestones were defined to provide a direction and they challenged the lean activities of the respective warehouse managers within their roles. These milestones were to be reached during the project period. The first milestone required value stream mapping, value stream design, and a project plan. The project plan had to show how the gap between the two value streams would be closed. These represented parts of the system-CIP cycle. The second milestone involved establishing regular communication and visualizations. The latter included the visualization of standards, process statuses on the shop floor, and major key performance indicators. The second milestone served as preparation for the third, which required one closed point-CIP cycle from the participating warehouses. In addition to regular communication and target conditions, three other elements were included: a quick reaction system; problem solving methods; and process confirmation.
Measuring
Three different measurement techniques were used to generate a holistic picture of warehouse performance. These included the:
- Bosch Logistics Warehouse Assessment (BLWA) to track the success of the empowerment;
- Result key performance result indicator (KPR) tracking, e.g., total warehouse productivity
- Monitoring key performance indicator (KPI) tracking, for instance, the incoming area productivity represented the outcome (assuming that quality and on-time-delivery before and after lean empowerment was already achieved to a large degree)
The BLWA is a lean assessment for the warehouse environment that was a derivative from a new generation of lean assessments that were used within the production environment. In order to reach the milestones, the lean maturity of the warehouses was recorded with the BLWA before warehouse activities began and at the end of the project.
Productivity figures from January 2010 to December 2011 are available for each warehouse. From the beginning of the year 2010, warehouses in the WE group measured the monthly productivity of the entire warehouse operation. Each
warehouse reported the monthly average.
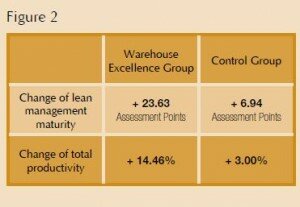
Also for the control group with 56 warehouses the lean assessment results and productivity figures were recorded where available. Figure 2 shows the development of the KPR and BLWA scores of the development of the control group versus the WE group. The control group increased, on average, their productivity by around 3 per cent and its BLWA score by 6.94 points. In contrast, the WE group improved their productivity by an average of around 14 per cent and its BLWA score by 23.64 per cent.

Figure 2
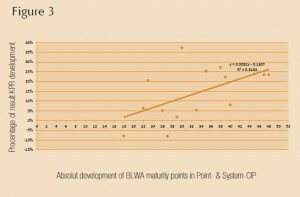
However, do we really know now if more lean creates more productivity improvement? In order to answer this question we would like to discuss the relationship between the assessment results and the result KPR of theWE group with the help of figure 3. The abscissa is the absolute lean maturity development in the system-CIP and the point-CIP. The ordinate is the percentage of the result KPR development from the year 2010 to year 2011. Each point represents one warehouse and the line represents the trend line. The trend line hits the abscissa at the value of 15.94. This indicates that even if some efforts are taken the expected positive lean effect on the productivity KPR might not be reached. A minimum investment is necessary to gain from the benefits. The slope of the trend line is 0.0082, which implies a positive trend, showing that if more lean efforts are taken, the productivity gain is also higher. The coefficient of determination is 0.3184, which indicates how well the relation can be described by a linear function.
From this we can assume that a relationship between the two factors can be seen in Figure 3, but a linear function to describe this correlation is not adequate. For example, the coefficient of determination is 0.3184 for a linear regression, which is far too low to describe that correlation.

The study proves that lean has a positive impact on performance indicators and this should support the managerial decision process to invest in lean activities within the warehouse environment. We were also able to show that a minimum investment in lean work is needed before results can be shown, the reason for this being, that you do not buy a solution like a FIFO lane, instead you invest in changing the culture of your company by the empowerment of your staff. You also align the workforce to reach the set targets systematically. Your success is not based on luck, it lies in your hand.

